Ad Hoc reports allow users to slice and analyze data, which can then be added to dashboards. An Ad Hoc report can be a chart, table, or pivot table. Restaurant365 comes with a number of pre-defined Ad Hoc reports. With the proper security level, users can also create their own. Ad Hoc reports is available with the Business Analytics module.
Article Topics:
Navigation
Ad Hoc reporting can be accessed from both Smart Ops and the Accounting module.
Smart OpsIn the left navigation menu, select Ad Hoc Reporting. |  |
AccountingIn the Reports section of the left navigation menu, select Ad Hoc Reports. |  |
Ad Hoc Reports Page
Once opened, four drop-down menus will appear for editing / creating reports.

| Field | Description | |
| 1 | Reports | A drop-down listing that enables you to select from the Ad Hoc reports created by your company. Once selected, the report will populate the screen
|
| 2 | Create Chart Of | This allows you to create a new chart based on a selected data set, or domain (listed below). Once a domain is selected, the screen will open to begin designing a new chart. |
| 3 | Create Crosstab Of | This allows you to create a new crosstab, or pivot table, based on a selected data set, or domain (listed below). Once a domain is selected, the screen will open to begin designing a new crosstab. |
| 4 | Samples | A listing of sample Ad Hoc reports to use or further develop. Once selected, the report will populate the screen. |
 will appear next to the drop-down arrow. Click this to delete the report
Available Data Sets
Reports in this module must be based on pre-defined sets of data called Domains that come with the system. These domains will appear in the Create Chart Of and Create Crosstab Of drop-down listings. The following is the list of available domains:
| Domain | Description |
| Daily Sales Summary | Both Sales and Labor data |
| Franchisee Sales | Franchise Sales |
| Labor Details | Only Labor data |
| Purchase Detail | Everything associated with AP transactions and Inventory |
| Sales Detail | Everything that hits the Credits side of the DSS Journal Entry |
| Sales Payments | Everything that hits the Debits side of the DSS Journal Entry; drives into the POS data |
| Transaction Details | Pulls in anything seen as a transaction (Inventory Count, Commissary, ect.) to display a more detailed view of each transaction |
| Transactions | Pulls in anything seen as a transaction to display more of a summarized view of Vendors/Customers |
Key Ad Hoc Elements
The report window shows the created report. In Editing mode, users have access to a list of fields and measures. These can be added to the report, and new fields and measures can be created.
This also shows the Drill-down & Filters and the Format Visualization panels. Users can edit adjust the report as needed. To view a detailed listing of all the elements in the report window, click here.
Creating A Report
To create a report, follow these steps:
1) Make a selection from the Create Crosstab Of dropdown.
For first-time or infrequent users, selecting a domain, or data set, from the Create Crosstab Of is a great way to start.

Available domains include:
- Daily Sales Summary
- Franchisee Sales
- Labor Details
- Purchase Details
- Sales Details
- Sales Payments
- Transaction Details
- Transactions
Users can also begin with a Sample template, located just after the Create Crosstab Of drop-down, as a foundation for your new report.
2) Select and add fields to the report.
Fields are pre-defined in R365 and appear in the Fields Box if they are used in the domain initially selected. To select a field, double-click the field name, right-click and select Add to Rows or Add to Columns, or drag and drop the field onto the report.

3) Select and add measures to the report.
Measures are also pre-defined in R365 and are generally numbers, such as amounts, percentages, and counts, used as values in a report. Select all of the desired measures by double-clicking the name, right-clicking and selecting Add to Columns, or dragging and dropping the measure to the report.

Measures can also be custom-made by clicking on the Calculated Measures Button next to Measures and filling in the listed fields.
4) Add and adjust filters as needed.
Filters are restrictions on the data, so you can specify a certain date range, specific list of locations, etc. for this report. Multiple filters can be added to a report by right-clicking a field or measure and selecting Create Filter or by dragging and dropping a field or measure in the Filter Box.

Custom Filter Expressions can also be used to limit data by the selected Filter Section. When finished, make sure to click the Apply button to update the report based on the filters.
Once a filter has been added, the filter can be adjusted as needed.

5) Organize rows and columns.
Rows and columns can be adjusted accordingly by clicking and dragging fields across both Rows and Columns within the column and row layouts in the top ribbon. Measures can also be rearranged, but only within the columns.

Even though these should be organized as needed before finalizing your report, they can be adjusted again after the desired report type is selected.
Users can also rearrange from the visualization by right clicking a field or measure and select Move Right or Move Left.
6) Select a visualization type.
Even if the report began as a Crosstab, it can be changed to a different visualization by clicking the visualization iconin the top ribbon.

This will open the visualization selector. Users can review and select a visualization type. Each selection has a field/measure requirement. Once selected, the data will be displayed in the new visual representation selected.

7) Title the report.
The title in the report will become editable if clicked. It can also be edited from the Format Visualization panel. After the title is updated, the report can be saved.

8) Save the report.
To save the report, click the save icon in the top ribbon.

Once Save is clicked, a drop-down will appear with the following values:
- Save Ad Hoc View - This option will overwrite the existing Ad Hoc with your changes. Pre-defined Ad Hoc reports built by Restaurant365 cannot be modified, so this option will not be available on those.
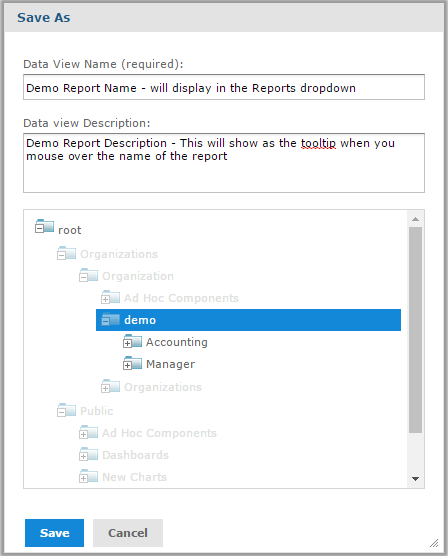
- Save Ad Hoc View As... - This option will leave the original report un-modified and will save your changes as a new report where you provide a new name. Once you select this option, the 'Save As' window (pictured below) will pop up where you can set the name of the report and choose where to save it. Once you've typed in the name, move to the folder hierarchy at the bottom of the pop-up window and follow the steps listed below:
- Click the '+' sign next to each folder in the following order:
+Root > +Organizations > +Organization > then click on the folder with your site's name (my site name in the screenshot below is 'demo')- Note: Folders will appear grayed out, but you will be able to expand them to your site folder
- Select either the Accounting or Manager folder, listed within your site folder, and click 'Save' to save your report. Each folder provides access to only certain Users:
- Accounting Folder - Saving in the Accounting folder will restrict access from any User that doesn't have the Accounting Manager or Full Access role
- Manager Folder - Saving in the Manager folder will make it available to Users with the more restricted Restaurant Manager role
- Click the '+' sign next to each folder in the following order:
- Save Ad Hoc View and Create Report - This option is never used and can be ignored